Skip to Main Content
Carrington Mortgage Services, LLC
Skip to Main Content

Company News

Rise in Non-Farm Payroll

Last Week in Review: Non-farm payrolls rose in August. So did home prices in July.
5C56CC5D-E0DE-473F-858F-CD4295DAAA4F

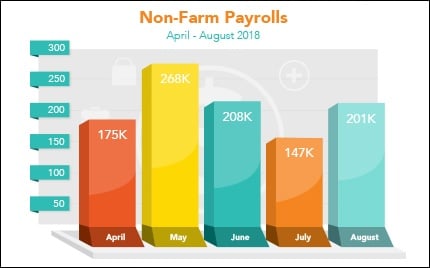
U.S. employers hired 201,000 new workers in August, above the 187,000 expected, the Bureau of Labor Statistics reported. However, June and July were revised lower by a total of 50,000 jobs. Job gains have averaged 185,000 per month over the last 3 months. The Unemployment Rate remained at 3.9 percent.
Perhaps the biggest news within the report was the 0.4 percent gain in wages from July to August, while year-over-year wages increased by 2.9 percent, the highest annual increase in nine years. Overall, this was a solid report as the labor sector is at or near what's considered full employment.
Home prices rose at a solid pace in July. Research firm CoreLogic reported that home prices, including distressed sales, were up 6.2 percent from July 2017 to July 2018 and 0.3 percent from June to July of this year. Frank Nothaft, CoreLogic's chief economist, noted that gains are beginning to moderate due in part to higher home loan rates and home prices. CoreLogic forecasts that home prices will rise 5.1 percent from July 2018 to July 2019.
Mortgage Bonds fell in the latest week, especially after the strong labor market news. Home loan rates remain historically attractive.

Home Sales Fall for the Fourth Straight Month in July

Last Week in Review:
Existing Home Sales fell for the fourth straight month in July. New Home Sales declined on a monthly basis but improved annually.
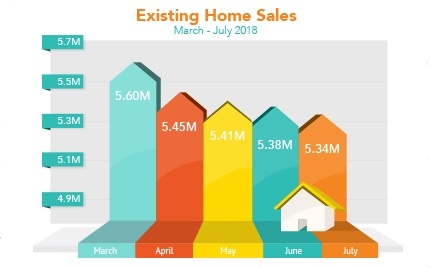
Market Trends_2018-08-27Existing Home Sales decreased 0.7 percent to a seasonally adjusted annual rate of 5.34 million in July from 5.38 million in June, the National Association of REALTORS® reported. This was their slowest pace in more than two years and 1.5 percent lower than July 2017. Sales have also declined on an annual basis for five straight months. Losses were seen in the Northeast, Midwest and South, with gains in the West. Unsold inventory is at a 4.3-month supply, well below the 6-month supply seen as normal.
Lawrence Yun, the NAR chief economist, said, "Too many would-be buyers are either being priced out, or are deciding to postpone their search until more homes in their price range come onto the market."
New Home Sales also fell from June to July, though inventory is closer to normal levels. July sales came in at an annual rate of 627,000, 1.7 percent below June's revised total of 638,000 (up from 631,000). While sales were down month over month, they were up 12.8 percent from July of last year. July sales plunged in the Northeast and fell slightly in the South, while the Midwest and West saw solid gains. There was a 5.9-month supply of new homes available on the market, nearer to the 6-month level considered normal.
In his speech at the Jackson Hole Economic Symposium, Fed Chair Jerome Powell noted that the Fed expects strong economic growth to continue and that there aren't any clear signs inflation will rise above the Fed's target range of 2 percent. Low inflation is typically good news for fixed investments like Mortgage Bonds and the home loan rates tied to them.
Mortgage Bonds have trended higher in recent weeks despite some reversals in the latest week. Home loan rates have reached some of their best levels of the year and remain near historic lows.

Housing Starts improved from June's nine-month low.

Last Week in Review: Retail Sales were stronger than expected in July. Housing Starts improved from June's nine-month low.
July Housing Starts rebounded slightly from the steep decreases seen in June. Housing Starts grew to a seasonally adjusted annual rate of 1.168 million units, which was a 0.9 percent increase from June's downwardly revised estimate of 1.158 million, the Commerce Department reported.

Housing Starts were down 1.4 percent from July 2017, however, likely due to higher construction costs for materials and land and labor shortages this year. Results were divided across the country with increases in the Midwest and South and declines in the West and Northeast. Single-family starts, which make up the bulk of the residential housing market, were up 0.9 percent from June.
There was a positive sign as Building Permits, a sign of future construction, increased 1.5 percent from June and are up 4.2 percent from a year ago. If this upward direction in permits continues, new home construction could get the boost it needs in the months to come.
Retail Sales data for July signaled that the U.S. economy is doing well. Retail Sales rose 0.5 percent from June, well above the 0.1 percent expected. However, June Retail Sales were revised lower to 0.2 percent from 0.5 percent, which took some of the luster from July's figures. On an annual basis, Retail Sales were up 6.4 percent from July of last year.
Both Stocks and Bonds saw seesaw trading in the latest week due to uncertainty overseas in Turkey and ongoing tariff issues with China. Home loan rates remain near historic lows.

Did inflation heat up in July?

Last Week in Review: Home price gains were strong in June. Did inflation heat up in July?
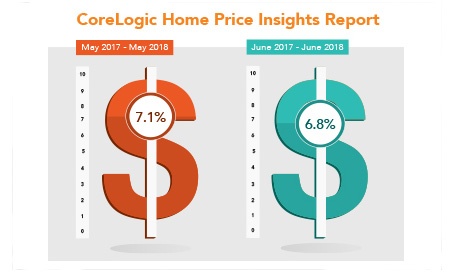
Market_Trends_2018-08-13Research firm CoreLogic reported that home prices, including distressed sales, rose 6.8 percent from June 2017 to June 2018. Prices were up 0.7 percent from May to June. However, gains could slow over the next year if further increases in home prices and home loan rates erode affordability. CoreLogic forecasts a 5.1 percent increase in home prices from June 2018 to June 2019.
The National Association of Home Builders also reported that rising home prices and higher home loan rates caused housing affordability to hit its weakest level in a decade in the second quarter of this year.
There was news on consumer inflation, as the July Consumer Price Index (CPI) rose 0.2 percent from June, which was in line with estimates. Core CPI, which strips out volatile food and energy prices, also matched estimates with a 0.2 percent monthly increase. While these monthly numbers were tame, on an annual basis Core CPI rose 2.4 percent when compared to July 2017, which was the largest 12-month increase since the period ending September 2008.
Inflation at the wholesale level was tame in July, as the Producer Price Index was unchanged from June.
The bottom line when it comes to inflation is that fixed investments like Mortgage Bonds lose value when inflation rises. Home loan rates are tied to Mortgage Bonds, so rates can tick up when Mortgage Bonds worsen. That's why inflation reports are always some of the most important to monitor.
For now, home loan rates remain attractive and near historically low levels.

Announcing The Carrington Investor Advantage Program


Overview
Effective Thursday, August 9, 2018, Carrington Mortgage Services, LLC (CMS) will introduce the Investor Advantage Program. The Investor Advantage Program is well suited for Investors with some credit challenges and is convenient without the need for income documentation and traditional debt ratios to qualify.  The borrower only needs to have positive cash flow for the subject property expressed as a Debt Coverage Ratio greater than 1.00.
Debt Coverage Ratio (DCR) is the expected Monthly Rents divided by the Total Monthly Payment. For example, if the expected gross rental amount for the property is $2000, then the total loan payment cannot exceed $2000. Other highlights are listed below.
General Highlights

  • Recent Mortgage/Rental Lates up to 1x30x12
  • Foreclosure, Short Sale, Deed in Lieu and Bankruptcy with 24 months seasoning
  • Non-warrantable Condos and 2-4 Units Permitted (max 75% LTV)
  • First Time Investors and Unleased Property (Refi Only) Permitted (max 70% LTV)
  • No Reserves required
  • No Income Documentation required
  • No Mortgage Insurance required

Investor Advantage Program Terms

  • Purchase, Rate/Term and Cash-Out Transactions (up to $750,000 cash-out)
  • 5/1 and 10/1 LIBOR ARMs
  • Maximum Loan Amount to $2.0MM
  • Investment Properties Only
    • Max LTV/CLTV with Debt Coverage Ratio ≥ 1.15: Up to 80%
    • Max LTV/CLTV with Debt Coverage Ratio 1.00 - 1.14: Up to 75%
    • Min FICO: 620

[btn link="/become-approved/" color="skyBlue" size="size-m"]Become Approved[/btn]

Home Prices Continue to Rise

Last Week in Review:
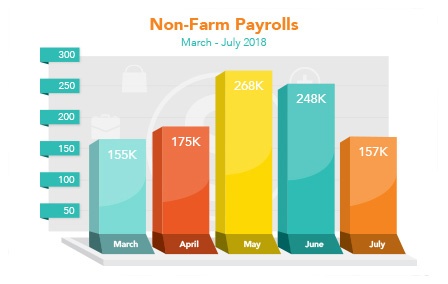
Job growth eased in July while annual inflation remained tame in June and home prices continued to rise.
Non-Farm Payrolls rose by 157,000 new jobs in July, below the 190,000 expected, the Bureau of Labor Statistics reported. However, the figures for May and June were revised higher by a total of 59,000 new jobs. The Unemployment Rate also fell to 3.9 percent. For the past three months, job growth has averaged 224,000 compared to 195,000 in the same period in 2017. Hobby and retail toy employment fell by 32,000 jobs in July, largely due to the closing of Toys R Us, which hurt headline Non-Farm Payrolls and could be a one-off number. Overall, the labor market continues to produce solid numbers.
Home prices rose steadily across the nation in May. The S&P CoreLogic Case-Shiller 20-City Home Price Index rose 6.5 percent from May 2017 to May 2018. This was in line with expectations and just below the 6.7 percent recorded in April. On a monthly basis, home prices were up 0.7 percent from April to May.
Market_Trends_2018-08-06
The Fed met and left its benchmark Fed Funds Rate unchanged, as expected. This is the rate banks use to lend money to each other overnight, and it does not directly impact home loan rates. The Fed noted that economic activity is growing at a strong rate and the labor market continues to strengthen.
If these strong signs for the economy continue, Stocks could benefit at the expense of Mortgage Bonds and the home loan rates tied to them. However, many factors impact both Stocks and Bonds, so it's important to keep an eye on the overall picture. For instance, low inflation is typically good news for fixed investments like Mortgage Bonds, and the annual Core Personal Consumption Expenditures edged lower to 1.9 percent in June. This was down from the 2 percent recorded in May and below the Fed's 2 percent target range.
For now, home loan rates remain attractive and near historically low levels.

Economic Growth Surged in the Second Quarter of 2018

Last Week in Review:
Home sales slumped in June while second quarter economic growth soared.

Market_Trends_2018-07-30

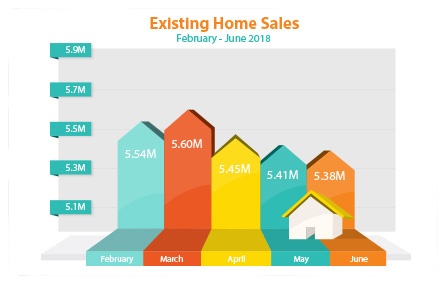
Existing Home Sales declined for the third straight month in June, falling 0.6 percent from May to an annual rate of 5.38 million units, the National Association of REALTORS® reported. Declines in the West and South outpaced gains in the Northeast and Midwest. From June 2017 to June 2018, sales fell 2.2 percent. Inventory of homes for sale on the market was at a 4.3-month supply, well below the 6-month supply seen as normal.
Lawrence Yun, NAR chief economist, says, "The root cause is without a doubt the severe housing shortage that is not releasing its grip on the nation's housing market. What is for sale in most areas is going under contract very fast and in many cases, has multiple offers."
Sales of new homes also fell 5.3 percent from May to June to an annual rate of 631,000, below the 670,000 expected. This was their lowest level since October 2017. However, sales were up 2.4 percent from June of last year. New Home Sales surged in the Northeast, but declined in the West, Midwest and South. The ongoing hurdles of rising lumber costs and shortages of labor and land were partly to blame.
Economic growth surged in the second quarter of 2018 due in part to a big rise in consumer spending. The Bureau of Economic Analysis reported that Gross Domestic Product (GDP) rose 4.1 percent from the 2.2 percent recorded in the first quarter. The report also showed that consumer spending jumped 4 percent in the second quarter from the dismal 0.5 percent in the first quarter. GDP is the monetary value of all finished goods and services produced within a country's borders in a specific time period. It is considered the broadest measure of economic activity.
Mortgage Bonds were weighed down by the strong GDP report as well as the positive news that trade concessions with the EU were announced. Home loan rates remain near historic lows.

Housing Starts Fall in June

Last Week in Review:
June saw Housing Starts slump and Retail Sales jump.

Market_Trends_2018-07-23

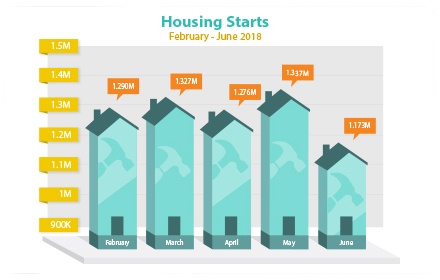
U.S. homebuilders broke ground on fewer homes than expected in June, due in part to higher costs for lumber, lack of available land and a shortage of construction workers. June Housing Starts fell 12.3 percent from May to an annual rate of 1.173 million units. This was the lowest level since September 2017, as Housing Starts declined in all four major regions of the country. Starts were down 4.2 percent from June of last year.
Single-family starts, which make up the bulk of residential housing, fell 9.1 percent in June from May. Multi-family dwellings of five or more units plunged 20.2 percent month over month. Building Permits, a sign of future construction, also declined 2.2 percent from May to an annual rate of 1.273 million. June's figures were a disappointment given that a lack of inventory has been an ongoing challenge to homebuyers in many areas of the country.
Retail Sales went in the opposite direction in June, as they were up 0.5 percent from May, the Commerce Department reported. May's figure was also revised sharply higher to 1.3 percent from 0.8 percent. From June 2017 to June 2018, sales rose 6.6 percent.
The Retail Sales report is considered the most-timely indicator of broad consumer spending patterns. The key takeaway is that people spend more when they are less concerned about the economy and their employment. Strong Retail Sales typically signal a belief that the economy is doing well.
Mortgage Bonds continued to trade in a sideways pattern in recent days due in part to the mix of economic data. Home loan rates remain near historic lows.

Annual Inflation Heating up

Last Week in Review:
Annual inflation ticked up while small business optimism neared record highs.
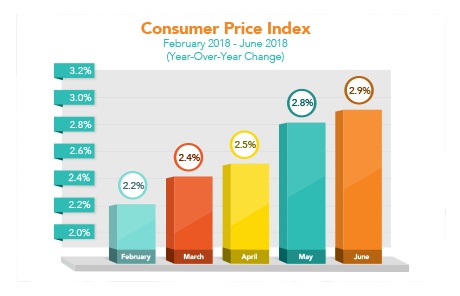
The Consumer Price Index (CPI) rose 2.9 percent in the 12 months ending in June, up slightly from the 2.8 percent annual reading in May. This was the largest annual increase since the year ending in February 2012, and it was led higher by energy costs. On a monthly basis, CPI increased 0.1 percent in June. Core CPI, which strips out volatile food and energy prices, rose 0.2 percent in June and was up 2.3 percent year over year.
The Producer Price Index (PPI), which measures wholesale inflation, rose 3.4 percent year over year in June, the largest increase in more than six years. The rise was also due in part to increasing energy prices. From May to June, PPI was up 0.3 percent.

Market_Trends_2018-07-16

Rising inflation is always a concern for fixed investments, like Mortgage Bonds, since inflation reduces their value. Home loan rates are tied to Mortgage Bonds, so they are negatively impacted when Mortgage Bonds worsen. However, many factors influence the markets. For example, if trade issues heat up, Bonds could benefit at the expense of Stocks if investors seek a safer haven for their money.
In the latest week, Stocks benefited from positive earnings and the news that the NFIB Small Business Optimism Index remained near record highs in June. Mortgage Bonds and home loan rates remain attractive and near their best levels historically.

ANNOUNCEMENT - 25 bps to 100 bps Pricing Improvement 

25 bps to 100 bps Pricing Improvement 
Effective immediately, Carrington Mortgage Services, LLC - Wholesale Lending Division has improved pricing on our Flexible Advantage programs (non-prime/near prime) :

  • Full Doc Loans
  • 12 Month Bank Statement Advantage
  • 24 Month Bank Statement Advantage

Program Enhancements 

  • Max Loan Amount increased to $2 Million
  • Maximum Cash out Increased to $750,000

Contact your Account Executive for more information, and make sure to check out our rates.
Become an Approved Carrington Broker Today! Apply now.

1 33 34 35 36 37 49
CAREERSINVESTORSABOUT USCORRESPONDENT

Equal Housing Opportunity An Equal Housing Opportunity Lender. Copyright 2007 - 2025 . Carrington Mortgage Services, LLC headquartered at 1600 South Douglass Road, Suites 110 & 200-A, Anaheim, CA 92806. NMLS ID # 2600. Toll Free # 800-561-4567. All rights reserved. Restrictions may apply. All loans are subject to credit, underwriting and property approval guidelines.  Nationwide Mortgage Licensing System (NMLS) Consumer Access Web Site: www.nmlsconsumeraccess.com.

The content of this website is intended for licensed third-party originators or brokers only and may not be duplicated or disseminated to the public. Carrington Mortgage Services, LLC is one of the leading wholesale mortgage lenders.

Government Agency Approval | FHA Non-Supervised Mortgage Approval #: 24751-0000-5 | VA Automatic Lender Approval #: 902324-00-00

linkedin facebook pinterest youtube rss twitter instagram facebook-blank rss-blank linkedin-blank pinterest youtube twitter instagram